

Understanding exponential growth is a prerequisite to understanding the pandemic.
I’ve had many conversations about the public health response to COVID-19 over the past year. Setting aside more extreme conspiracy thinking, I’m increasingly convinced that most of the non-conspiracy skepticism of public health measures comes down to misunderstanding exponentials.
People keep using the term, but I do not think it means what they think it means.
I’m not here to defend every single public health measure or government decision — many are stupid, and many are reasonable. However, if you don’t understand exponential growth, you simply can’t make an accurate risk assessment. If you can’t make an accurate risk assessment, how could you reasonably assess the tradeoffs?
For example, a talking point that’s been circulating in April among the anti-lockdown crowd in Ontario is to compare hospital capacity in previous years to during the pandemic. (“ICU occupancy has been consistently at 80-90% for years, so why is it an emergency now? “) It’s a basic failure to understand exponential math. Being at 90% ICU capacity while a virus is on an exponential growth curve during a pandemic is not the same as being at 90% capacity in 2018.
I’m increasingly convinced that many people just don’t understand the math.
A Difference in Kind: Addition versus Multiplication
I’ve tried to explain exponential growth before, but I find people still seem to think “exponential” just means “really big” or “increasing quickly.” That’s not what exponential growth is. Exponential growth is when a number is multiplying by a constant. It means really small numbers can become astronomically big really quickly.
I’ve had multiple people tell me that they really do understand exponential growth, right before comparing the exponential growth of COVID-19 to the linear growth from suicides or opioid deaths, for example. It’s clear that they don’t actually get the math. Linear growth is by addition, not multiplication. There has been a real, tragic and serious increase in suicides [Edit: or not, apparently], but “increase” does not mean exponential growth. Suicides simply do not multiply on top of each other. Neither do overdose deaths.
There’s a fundamental difference between addition and multiplication, in terms of top speed and highest reach.
Let’s say you have a really cool performance of a song.
If you play it at a concert venue, 100 people might see it. You play at a second, and 200 people have seen it. A third, 300. Or maybe you go busking at Dundas Square, and several thousands see your performance in an afternoon. Or maybe you fill a venue of 10,000. This is linear growth. You can reach a lot of people, but it’s by addition. Each time you perform, you add another batch of views. You could reach thousands, tens of thousands, maybe a few million people over the course of several months if you played hundreds of massive concert venues.
What if instead of linear growth from in-person performances, you upload a video to the internet? And it takes off. What’s the term for that again? Oh, yeah — going viral. This is exponential growth. If something goes viral, you can reach millions in days. Because views don’t increasing linearly, by addition, but they multiply — every person who shares a video leads to more to view and share, and more who view and share, and so on.
What is totally impossible via linear growth happens all the time via exponential growth. Going viral is exponential growth.
The difference between linear growth and exponential growth is the difference between the reach of a street busker and a viral video online.
It’s like the difference between pedestrian travel and train travel. Who cares if it’s a slow train versus Usain Bolt? If you’re going any further than the shortest of distances, it’s not even going to be close. (Also, try stopping a train as fast as a pedestrian can stop.)
In computer science, we use something called Big O notation to classify algorithms based on their complexity. In Big O notation, the specific numbers don’t matter, only the “order of magnitude” — the kind. For example, is it linear, or exponential? Who cares what the particular numbers are — after any non-trivial period of time, a linear algorithm is a different order of magnitude than an exponential one. The growth curves are going to be totally different. Linear growth points east. Exponential growth points north.
Different kinds of curves are simply headed in different directions.
I was once working on a script to process a very large data set for all practitioners in an industry in Ontario. It took about 18 minutes for this script to run, every single time. It was getting unmanageable, as the data set grew and grew. So, one day I carefully analyzed the code. I realized that the way the program was written created exponential work for the CPU. And I realized I could rewrite it, in a linear way. Do you know how long it took to process the exact same data set, when the strain on the CPU was linear instead of exponential? 7 seconds.
Exponential and linear math are just different in kind. Take a look at a standard graph showing the difference. The exponential function is green, the linear is read.
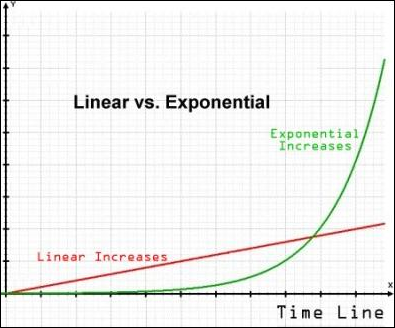
It’s the difference between heading north and heading east, between aiming up versus towards the horizon, between the reach of a street busker and a viral TikTok video. It’s literally the difference between growth by addition and growth by multiplication. It doesn’t really matter what the particular numbers are, past a certain point. The type of curve is just radically different, like the difference between walking and taking the train.
Pandemic Math
There’s a reason we call explosive, exponential growth on social media “going viral.” That’s how viruses can spread.
This is why COVID-19 is a different kind and often a different level of risk than many of the other serious problems we’ve faced over the past year.
This 9 minute video offers a fantastic explanation of exponential growth and COVID-19 from the early days of the pandemic:
The key to understand is that the number of cases multiplies by a constant. This means really small numbers can get really big really quickly. As the video explains, if the number of cases is multiplying by 10 every 16 days, it means that a country with 64 cases is only about a month behind a country with 6,593 cases.
Small numbers are a big deal when you’re in a period of exponential growth, because they don’t stay small for very long.
Take Ontario’s COVID-19 data. It took 8 months to go from 0 to 100k cases, and less than 7 weeks to go from 100k to 200k cases.
The effective reproductive number (R) is critical. The video explains how sensitive exponential growth is to the constant. Little changes to this number make a massive difference. In my mind, it’s like aiming a laser pointer at a great distance. Little shifts in your aim make a huge difference to the trajectory. For example, the difference in the video is 21,000 cases growing to 100,000,000 in 61 days with a growth rate of 15%, or 21,000 cases growing to 400,000 in 61 days with a growth rate of 5%. Exponential growth is always heading north, but the growth rate determines how quickly it is you’re travelling north — the steepness of the curve.
This is one of the reasons why there’s such a focus on cases. Yes, most people recover, but cases provide us with a speedometer reading on the exponential curve. R is the accelerator. If R > 1, you still have your foot on the gas. If you have your foot on the gas, the car is not only going to keep moving — it’s going to keep moving faster and faster. It’s speeding up — accelerating. The curve is getting steeper. When R = 1, that’s taking your foot off the accelerator. This is the inflection point. You’re still moving forwards, but gradually slowing down. This is bending the curve.
Why is there all this focus on cases? Cases are the speedometer. It’s the indicator of how fast we’re accelerating. Yes, it matters how much gas you have in the tank and how much washer fluid there is and whether or not you need an oil change. There are other indicators for that. But we watch the speedometer to see how faster we’re going.
The ceiling also matters. As the video explains, true exponentials rarely exist in the real world. What we’re really seeing is a logistic curve, which is indistinguishable from an exponential curve at the start, but levels out (“flattens”) after a certain point. The problem is, when that point is millions of cases, that’s thousands and thousands dead (nevermind the long haulers). Hence, the calls to intervene and “flatten the curve” earlier. We’re still nowhere near the natural ceiling of the growth curve in Canada.
Yes, cases are not hospitalizations or deaths, but hospitalizations and deaths follow from cases — and also follow a pattern of exponential growth. More importantly, even though the individual death rate for COVID-19 is low, the overall death toll has been high because a tiny percentage of a very large number can still be a large number. The Spanish flu, for example, infected almost a third of the world’s population.
Exponentials are cruel
Exponentials are so cruel that nobody wants to look them in the eye.
That’s what Dylan Morris said, a postdoc at UCLA who studies virus transmission and quantitative biology of infectious diseases, when talking with Zeynep Tufekci.
Tufekci has been ahead of the curve in understanding COVID-19 since January 2020. I quoted her article on complex systems in my first blog post on COVID-19, and I shared her article warning about the B117 variant in December.
To understand the difference between exponential and linear risks, consider an example put forth by Adam Kucharski, a professor at the London School of Hygiene & Tropical Medicine who focuses on mathematical analyses of infectious-disease outbreaks. Kucharski compares a 50 percent increase in virus lethality to a 50 percent increase in virus transmissibility. Take a virus reproduction rate of about 1.1 and an infection fatality risk of 0.8 percent and imagine 10,000 active infections—a plausible scenario for many European cities, as Kucharski notes. As things stand, with those numbers, we’d expect 129 deaths in a month. If the fatality rate increased by 50 percent, that would lead to 193 deaths. In contrast, a 50 percent increase in transmissibility would lead to a whopping 978 deaths in just one month—assuming, in both scenarios, a six-day infection-generation time.
Transmissibility increases can quickly—very quickly—expand the baseline: Each new infected person potentially infects many more people. Severity increases affect only the infected person. That infection is certainly tragic… [The variant] is, however, a bigger threat to society because it can dramatically change the number of infected people. To put it another way, a small percentage of a very big number can easily be much, much bigger than a big percentage of a small number.
The math matters.
Modelling for variants in a city like Toronto (11,700 active cases at present…), an increase of 50% in the individual death rate would increase deaths from 129 to 193 in one month (+64), but an increase in the transmissibility by 50% would increase deaths from 129 to 978 (+849).
That’s because an increase in the individual death rate only affects individuals who get infected, but an increase in transmissibility steepens the exponential growth curve. It has a exponential effect on the outcome.
Exponentials are essential to understanding the risks of this virus.
If we don’t understand the risks, we can’t have a meaningful conversation about tradeoffs.
“Exponential” doesn’t just mean “big increase.” Exponential growth means small numbers can become massive very quickly.
The math matters. I can’t fathom how we can have a rational conversation about risks and tradeoffs when so many people think they understand exponential math, but actually don’t.


